HRPDviewer
About HRPDviewer
  • Motivation of HRPDviewer

  • What is HRPDviewer?
  • Construction of HRPDviewer
  • Human ribosome profiling data collection

  • Data processing

  • Calculation of translational levels of mRNA transcripts and genes

  • Implementation of HRPDviewer website
  • Usage of HRPDviewer
  • Database interface
  • Motivation of HRPDviewer
    A lot of ribo-seq data have been generated in various studies, so databases are needed for depositing and visualizing the published ribo-seq data. Nowadays, GWIPS-viz and RPFdb are the two largest databases that were developed for this purpose. However, two challenges remain to be addressed.

    1. Both databases align the published ribo-seq data to genome. Since ribo-seq data aim to reveal the actively translated mRNA transcripts, to transcriptome rather than to genome should the ribo-seq data be aligned.

    2. Both databases can only view the ribo-seq data around a specific genomic location. Neither of them can simultaneously visualize the ribo-seq data on mRNA transcripts produced from different genes located far away from each other in the genome.

    To address these two challenges, we develop HRPDviewer (Human Ribosome Profiling Data viewer)


    What is HRPDviewer?
    HRPDviewer
    1. collects 610 published human ribo-seq data from Gene Expression Omnibus (GEO),

    2. aligns the data to transcriptome,

    3. provides visualization of the data on mRNA transcripts.

    Users can compare and visualize the ribo-seq data mapped on different mRNAs under different physiological conditions. This kind of visualization provides novel biological insights. By viewing the ribo-seq data mapped on the mRNAs of different genes, users can know which genes’ mRNAs are highly translated under a specific physiological condition. By viewing the ribo-seq data mapped on different mRNA isoforms of the same gene, users can know which mRNA isoforms are highly translated under a specific physiological condition. In the future, we will keep updating HRPDviewer if new human ribo-seq data are found in the literature. We believe that HRPDviewer is a useful resource for studying translational regulation in human.


    Human ribosome profiling data collection
    610 human ribosome profiling data sets from 64 studies were collected from Gene Expression Omnibus (GEO). We assigned these 610 ribo-seq data sets to 14 research topics.


    Research Topic # of ribo-seq data sets # of publications
    Apoptosis 6 1
    Cancer Mechanism 85 6
    Cell Cycle 27 4
    Circadian Rhythms 48 1
    Disease 62 4
    microRNA Regulatory Effect 24 3
    Mitochondrial Translation 4 1
    mRNA Modification 34 3
    mTOR Pathway 62 3
    Protein Stability 25 2
    RPF Methodology 20 8
    Stress Condition 139 8
    Translational Regulation Mechanism 177 22
    Virus Infection 106 6


    The details of these 610 collected human ribosome profiling data sets can be found in Supplementary Table 1.


    Data processing

    Step1. Install the following software tools.

    1. SRAtoolkit v2.6.3 (https://www.ncbi.nlm.nih.gov/sra/docs/toolkitsoft/)

    2. Cutadapt v1.4.2 (http://cutadapt.readthedocs.io/en/stable/guide.html)

    3. RSEM (https://github.com/bli25wisc/RSEM/archive/master.zip)

    4. SAMtools (http://www.htslib.org/)

    Step2. Download and decompress our pipeline.zip (http://cosbi4.ee.ncku.edu.tw/HRPDviewer/pipeline.zip), then you will have a pipeline folder.

    Step3. Put your ribo-seq data (e.g. SRR493747.sra) in our pipeline folder.

    Step4. In our pipeline folder, start to process SRR493747.sra using the following procedure.

    1. SRAtoolkit v2.6.3 was used to convert the .sra files to .fastq files.

    Input SRR493747.sra
    Output SRR493747.fastq
    Command $ fastq-dump SRR493747.sra

    2. Cutadapt v1.4.2 was used to trim adaptor linker sequences or poly-(A) tails from the 3’ ends of reads.

    Input SRR493747.fastq
    Output SRR493747_trimmed.fastq
    Command $ cutadapt \
    -a CTGTAGGCACCATCAAT \
    -u 1 \
    --minimum-length 27 \
    --maximum-length 40 \
    --discard-untrimmed \
    -o SRR493747_trimmed.fastq \
    SRR493747.fastq

    3. RSEM was used to align the reads to the reference human transcriptome and generate two files (the readdepth file and bam file).

    Input SRR493747_trimmed.fastq, ref_transcriptome_folder
    Output SRR493747_result.transcript.bam, …
    Command $ rsem-calculate-expression \
    -p 8 \
    --strand-specific \
    SRR493747_trimmed.fastq \
    ref_transcriptome_folder/ref_transcriptome \
    SRR493747_result

    Input SRR493747_result, gene_id.txt
    Output SRR493747_result.transcript.readdepth, …
    Command $ rsem-plot-transcript-wiggles \
    --gene-list \
    --show-unique \
    SRR493747_result \
    gene_id.txt \
    figure.pdf

    4. SAMtools was used to convert the .bam file to .sam file.

    Input SRR493747_result.transcript.bam
    Output SRR493747_result.transcript.sam
    Command $ samtools view \
    SRR493747_result.transcript.bam \
    -o SRR493747_result.transcript.sam

    5. Our python scripts were used to generate two folders (called SRR493747_NRPM_folder and SRR493747_TL_folder). The first folder (SRR493747_NRPM_folder) contains 38401 files, each of which contains the NRPM (normalized reads per million mapped reads) values on all nucleotide positions of an mRNA transcript (e.g. NM_00014). The second folder (SRR493747_TL_folder) contains two files. The file (Isoform_TL.csv) contains the translational levels (TLs) of 38401 isoforms. The other file (Gene_TL.csv) contains the TLs of 19242 genes.

    Input SRR493747_result.transcript.sam, SRR493747_result.transcript.readdepth, human_rna.coord
    Output SRR493747_NRPM_folder, SRR493747_TL_folder
    Command $ bash norm_exp.sh \
    SRR493747_result.transcript.sam \
    SRR493747_result.transcript.readdepth \
    human_nm_rna.coord \
    SRR493747_NRPM_folder \
    SRR493747_TL_folder


    Calculation of translational levels of mRNA transcripts and genes
    The translational level (TL) of a mRNA transcript in a RPD is defined as the average NRPKM (normalized reads per kilobase per million mapped reads) value of its coding region (CDS) in that RPD and calculated by the following formula
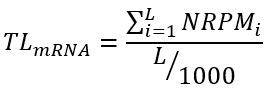

    where L is the length (in bps) of the coding region and i is the 
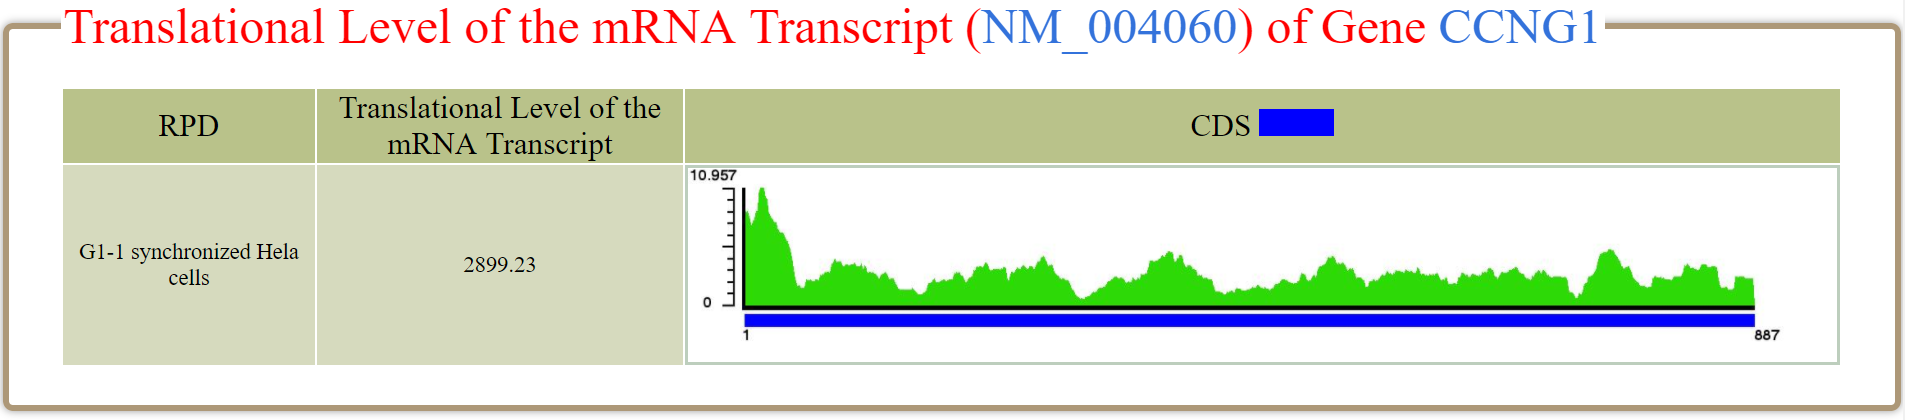
i-th position of the coding region. For example, in RPD (G1-1 synchronized Hela cells), the TL of NM_004060 (one mRNA isoform of the gene CCNG1) is 2899.23 where L=887.


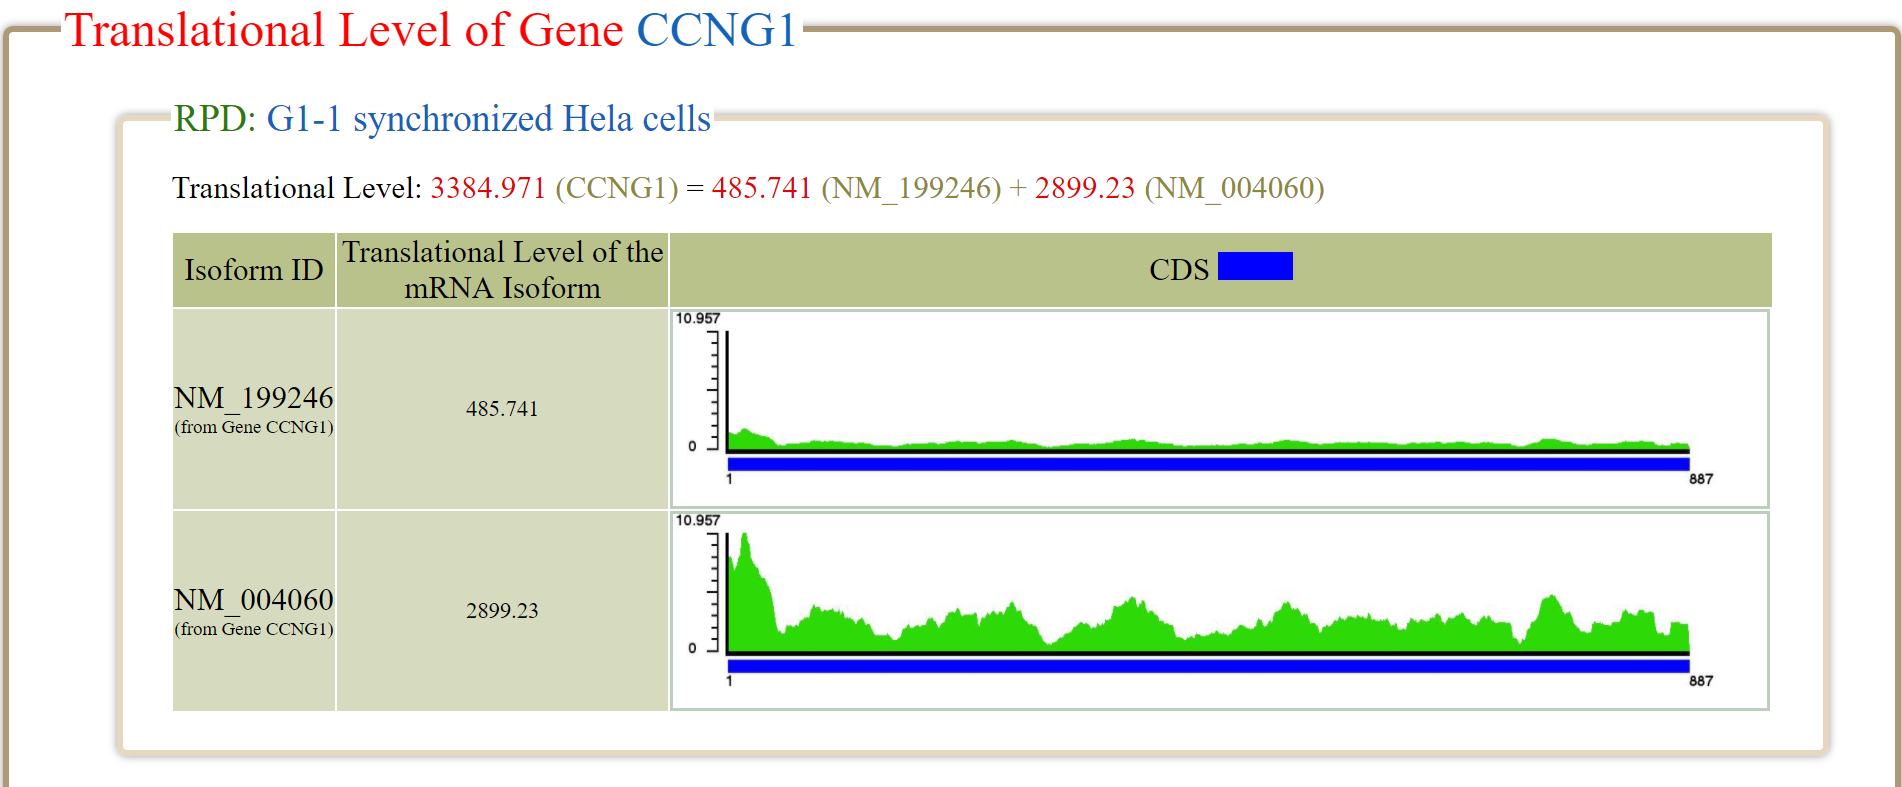
    The translational level of a gene (denoted as ) in a RPD is defined as the sum of the translational levels of all its mRNA isoforms in that RPD. For example, the gene CCNG1 has two mRNA isoforms (NM_199246 and NM_004060). In RPD (G1-1 synchronized Hela cells), the of NM_199246 and of NM_004060 are 485.741 and 2899.23, respectively. Therefore, the of CCNG1 is 3384.971 which equals the sum of 485.741 and 2899.23.


    Implementation of HRPDviewer website
    HRPDviewer was built using the scripting language PHP and Codelgniter framework. All tables were produced by JavaSscript and jQuery (a JavaScript library). All figures were generated using PHP GD library.


    Database interface
    HRPDviewer provides both a search mode and a browse mode.

    Search Mode:

    Users have to select the mRNA transcripts and RPDs of interest.


    After submission, HRPDviewer returns a result page containing two parts. The first part provides the information of the selected mRNA transcripts and RPDs.


    The second part provides two different views of the ribosome occupancy patterns on the selected mRNA transcripts in the selected RPDs:
    1. Viewing different selected mRNA transcripts in the same RPD.
    This kind of view allows users to compare the ribosome occupancy patterns on different mRNA transcripts in the same RPD. Users then can know the translation of different mRNA transcripts under a specific physiological condition. For example, NM_199246 (one mRNA isoform of the gene CCNG1) is more actively translated than NM_004354 (one mRNA isoform of the gene CCNG2) is in G1 synchronized Hela cells. On the contrary, NM_004354 is more actively translated than NM_199246 is in S phase synchronized Hela cells.


    2. Viewing the same mRNA transcript in different RPDs.
    The kind of view allows users to compare the ribosome occupancy patterns on an mRNA transcript in different RPD. Users then can know the translation of a specific mRNA transcript under different physiological condition. For example, NM_199246 (one mRNA isoform of the gene CCNG1) is more actively translated in G1 than in S phase of the cell cycle in Hela cells.


    Browse Mode:

    In the browse mode, users have to (i) input a list of genes of interest and (ii) select RPDs to be shown.


    After submission, HRPDviewer returns a page containing information (gene name, the number of mRNA isoforms, the translational levels in the selected RPDs) of each gene to be shown.


    When clicking on the “Gene Name” (e.g. CCNG1), HRPDviewer returns a page showing how the translational levels of the gene CCNG1 in different RPDs are calculated.


    When clicking on the “# of mRNA Isoforms”, HRPDviewer returns a page containing information (isoform ID and the translational level in the selected RPDs) of each mRNA isoform of the selected gene.


    When clicking the “isoform ID” (e.g. NM_004060), HRPDviewer returns a page showing how the translational level of NM_004060 in different RPDs are calculated.


    Go top